Cellanome at the CSHL Single Cell Analyses Meeting | November 12-15, 2025

View Poster
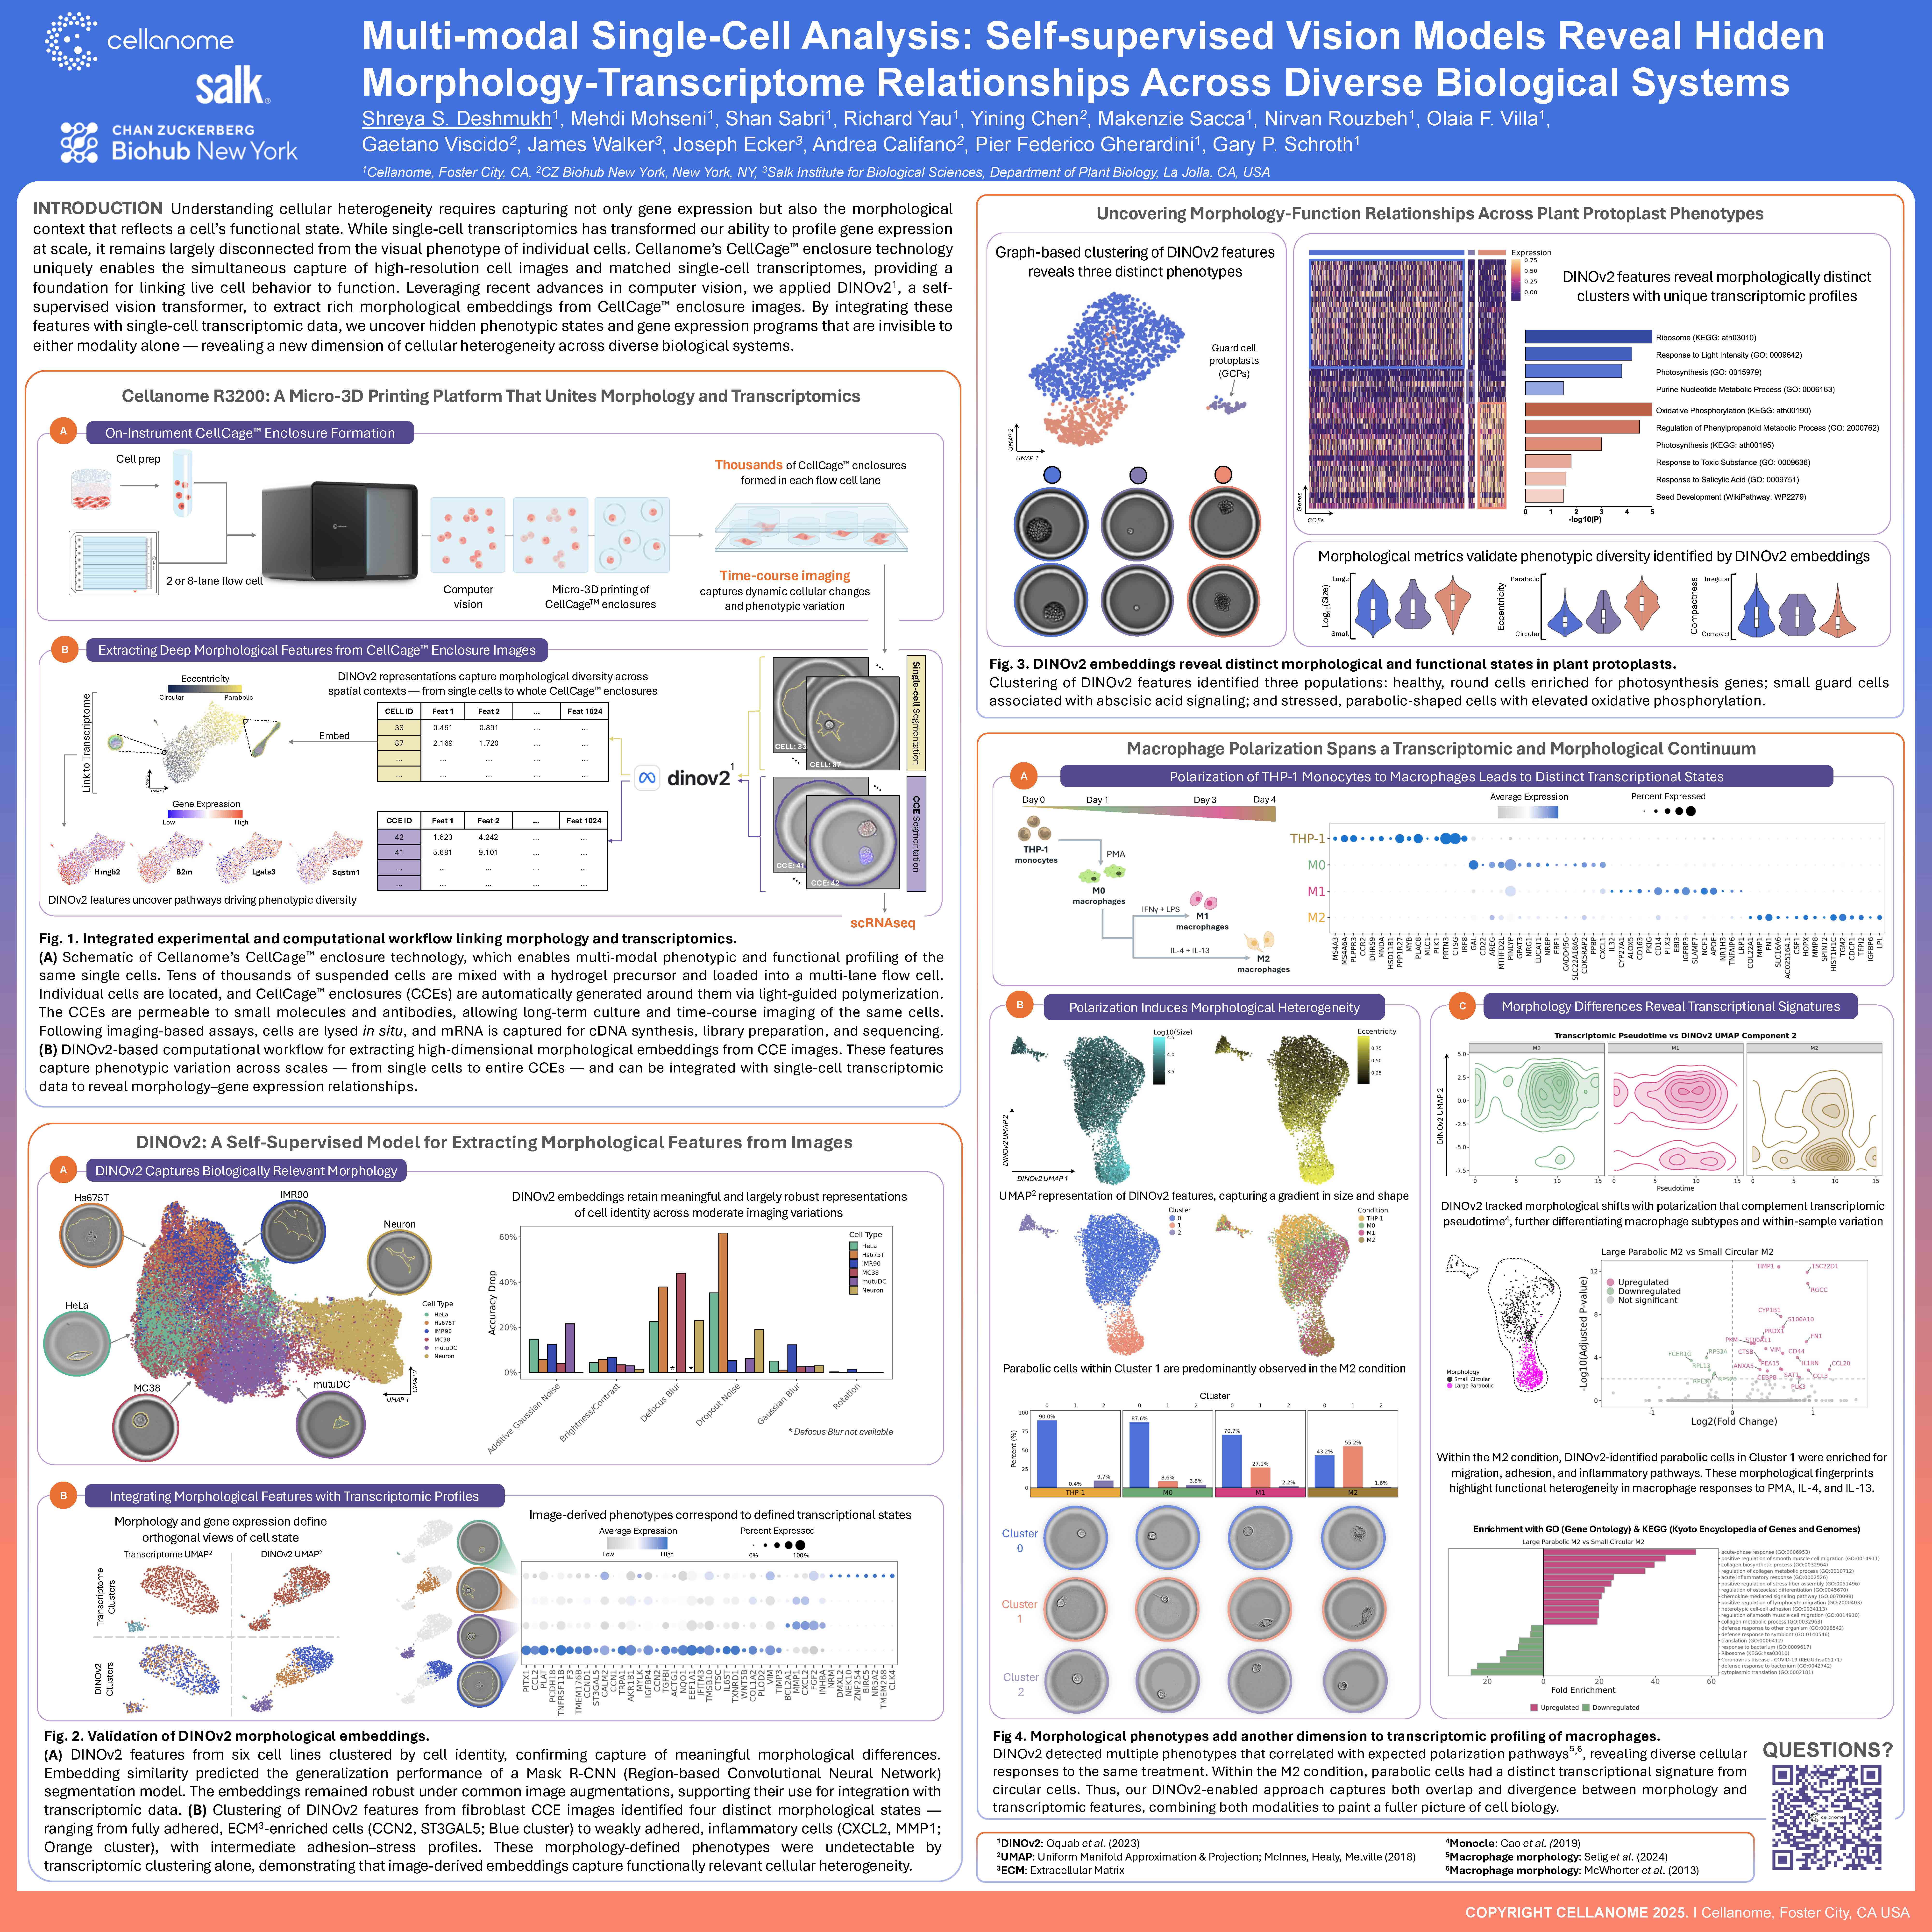
Case Study
Traditional single-cell RNA-seq captures gene expression but not the visual phenotypes that reflect how cells behave. Morphological features such as shape, size, or adhesion can reveal functional diversity that transcriptomics alone may overlook. Linking these modalities at single-cell resolution has remained technically challenging.
Approach:
Researchers used the Cellanome R3200 Platform to simultaneously capture high-resolution images and matched transcriptomes from the same individual cells across diverse biological systems.
Experimental systems:
- THP-1 monocytes polarized into M0, M1, and M2macrophages over 4 days
- Primary human fibroblasts cultured in CellCage™ enclosures
- Plant protoplasts from leaf mesophyll and guard cells
- Six mammalian cell lines for morphological validation
Multi-modal measurements:
- Time-course brightfield imaging tracked morphological changes in living cells within CellCage™ enclosures
- DINOv2 self-supervised vision transformer extracted 1,024-dimensional morphological embeddings from single cells and entire enclosures
- Single-cell RNA sequencing captured matched transcriptomes from the same imaged cells
- Integration of morphological and transcriptomic data revealed uncovered patterns invisible to either modality alone.
Key Findings:
Macrophage polarization spans a morphological continuum. DINOv2 detected multiple morphological phenotypes within each polarization condition that correlated with distinct gene expression programs. Within M2-polarized macrophages, parabolic-shaped cells showed enrichment for migration, adhesion, and inflammatory pathways compared to circular cells, revealing functional heterogeneity in responses to IL-4 and IL-13 treatment.
Fibroblast morphology defines adhesion and stress states. Clustering of morphological features identified four distinct phenotypes ranging from fully adhered, ECM-enriched cells (expressing CCN2, ST3GAL5) to weakly adhered, inflammatory cells (expressing CXCL2, MMP1). These morphology-defined states were completely undetectable by transcriptomic clustering alone.
Plant protoplast phenotypes correspond to functional specialization. Three morphologically distinct populations emerged: healthy round cells enriched for photosynthesis genes, small guard cells associated with abscisic acid signaling, and stressed parabolic cells with elevated oxidative phosphorylation markers. These findings demonstrate the platform’s robustness across kingdoms.
Why it matters:
This multi-modal approach reveals a new dimension of cellular heterogeneity by integrating what cells look like with what genes they express:
- Captures functional diversity missed by transcriptomics alone: Cells with similar gene expression profiles can exhibit distinct morphologies that reflect different functional states, adhesion properties, or stress responses
- Enables phenotype-first discovery: Morphological clustering can identify biologically relevant subpopulations before examining their transcriptional signatures, providing an orthogonal axis for understanding cell state
- Applies across diverse biological systems: The platform successfully linked morphology to function in mammalian immune cells, primary human fibroblasts, and plant protoplasts—demonstrating broad applicability
- Tracks dynamic cellular responses: Time-course imaging combined with endpoint transcriptomics connects temporal morphological changes to gene expression programs during differentiation or treatment responses
What's next:
The integration of morphological embeddings with single-cell transcriptomics can be extended to more complex biological questions:
- Screening drug responses or genetic perturbations to identify compounds that drive specific morphological and transcriptional phenotypes
- Analyzing primary tissue samples where morphological heterogeneity may reflect distinct microenvironmental niches or disease states
- Combining additional modalities (surface protein markers, metabolic sensors, or CRISPR perturbations) with morphology and transcriptomics for comprehensive single-cell profiling