
Resources: Blog
Biology in Motion: How CellCageTM Technology Keeps Cells Alive, Linked, and In Context
Cellanome Team
May 1, 2026
Biology doesn’t happen in snapshots. It unfolds as a continuous choreography of cells adapting, signaling, and interacting over time.
Most tools still force you to choose among scale and context, rich phenotypes and deep molecular readouts, or live imaging and single-cell omics.
Cellanome exists to close that gap. This post is a technology overview of how we do that, and, in particular, how CellCage enclosures actually work.
The field’s core problems: snapshots, fragments, and lost context
Over the last decade, single-cell genomics, imaging, and spatial methods have transformed what we can measure. But if you work in disease biology, you’ve probably run into the same limits we did.
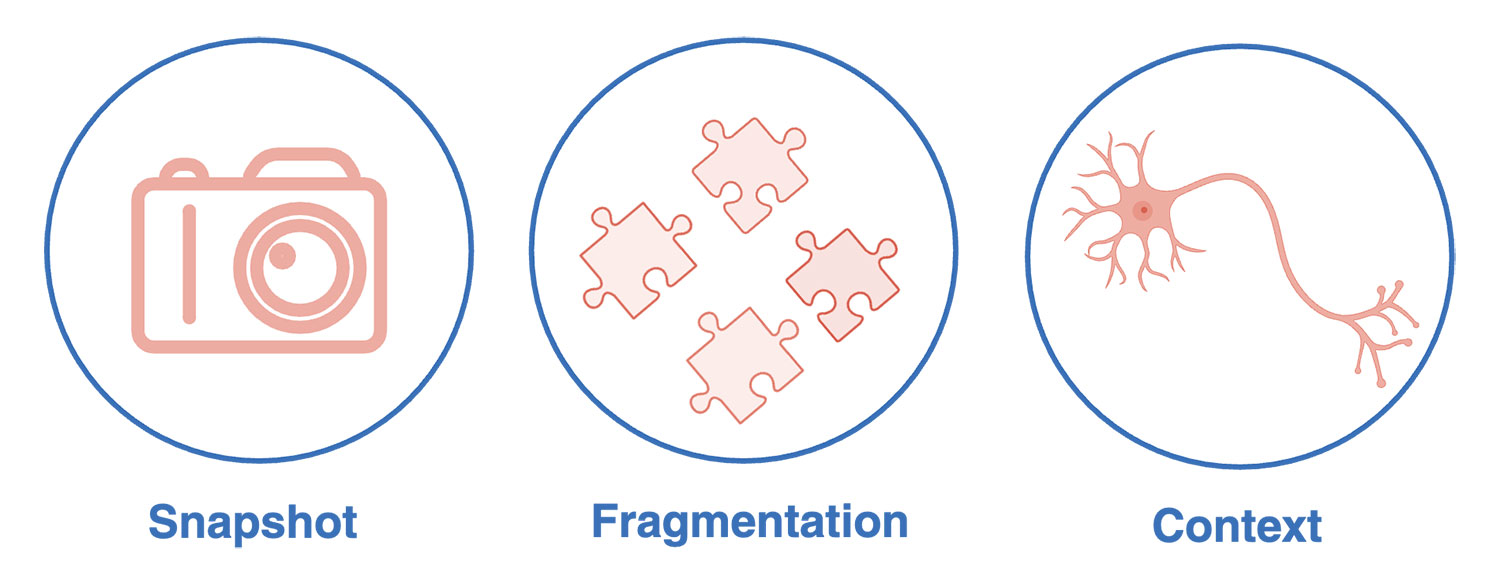
1. The snapshot problem
Single-cell RNA-seq and multi-omics provide rich molecular detail, but only for a single instant in time. Cells are lysed at capture, so you never see how the specific cell you sequenced behaved before that moment: whether it killed a target, secreted cytokines, extended a neurite, or survived a drug pulse.
2. The fragmentation problem
We often measure different aspects of biology on different cells:
- Imaging for morphology and function
- Separate plates or wells for functional assays
- A separate single-cell genomics experiment for transcriptomics
Connections between imaging, function, and -omics are then inferred at the population level. The cell-level linkage is gone, which is exactly where much of the interesting heterogeneity lives.
3. The context problem
Many platforms require cells in suspension or in non-physiologic formats optimized for molecular capture rather than biology.
Neurons, fibroblasts, immune cells in co-culture, organoids, these systems depend on adhesion, matrix, and local interactions. Dissociation or growth in the wrong geometry can fundamentally change the biology you’re trying to study.
Put together, these problems mean we can’t easily ask and answer questions like:
- Which individual CAR-T cells actually killed targets and persisted, and what are their transcriptional programs?
- Which tumor cells that survived treatment carry resistance-associated signatures?
- How does a given neuron’s morphology and activity evolve over days, and what gene programs track with resilience vs. decline?
What disease research actually needs from its cell biology tools
The underlying requirements are actually quite straightforward:
- Maintain living cells in biologically relevant microenvironments for hours to weeks.
- Enable adherent cells to attach, make connections, signal.
- Track morphology, function, secretion, and interactions longitudinally.
- Apply precisely timed perturbations and washouts.
- Link all phenotypic observations to single-cell transcriptomics, and CRISPR edits when relevant, from the same cells.
Do this at a scale that captures heterogeneity and rare subpopulations, not just averages.
How the Cellanome platform closes the gap
At a highlevel, the Cellanome platform is an integrated, live-cell, multimodal system comprising an instrument, flow cells, assays, and cloud-based analysis software designed to work together.
You load cells once into a flow cell. The instrument forms CellCage enclosures around the cells you care about, keeps them in place, and runs your experiment, including media exchanges, perturbations, and longitudinal imaging, over hours to days.
At the end, those same cells are lysed in place, and their RNA and guides, if you’re running a CRISPR screen, are captured and labelled for downstream sequencing. The result is a unified dataset in which every imaging feature and every sequencing read is linked to a specific CellCage ID.

Practically, this means you can measure multiple modalities in a single, integrated experiment on the same cell:
- Track the trajectory of an individual CAR-T cell's killing activity, secretion, and surface markers, then read out its transcriptome.
- Follow neurons as they extend neurites, change morphology, or alter activity patterns, then see the gene programs associated with each trajectory.
- Watch senescent cells emerge in culture, characterize their functional hallmarks, and tie those directly to RNA profiles.
All of this hinges on the core enabling technology: CellCage enclosures.
How does the Cellanome platform compare to existing approaches?
Many platforms claim multimodal capabilities. The key differences are which cells are measured, when they are measured, and how tightly the resulting data are linked.
- Compared to scRNA-seq alone
In a Cellanome study, each cell’s phenotypic history is preserved before sequencing. Cells are kept alive, their behavior and interactions are tracked over time, and then those same cells are sequenced. Imaging can serve as a functional label to classify sub-types and relate them to RNA programs. Imaging also strengthens interpretation: selecting any point in a transcriptomic cluster can reveal everything captured for that specific CellCage enclosure(CCE)—how many cells it contained, what it did over time, whether its shape changed, and whether it divided. - Compared to imaging alone
The workflow goes beyond images and morphology. Each behavioral trajectory, how a cell moved, divided, or responded, is linked to a transcriptome and, when relevant, to CRISPR perturbations from the exact cells that were observed. In other words, the images and the RNA come from the same experiment. - Compared to spatial transcriptomics
The platform works with living cells rather than fixed tissue. This makes it possible to go beyond “which cells share a neighborhood” and ask how specific interactions drive outcomes, including more distal interactions. Specific combinations of cells can be isolated, perturbations introduced, responses observed over time, and gene expression patterns used to explain the differences. - Compared to disaggregated workflows
Instead of splitting a sample across separate assays, the platform captures multiple measures from the same cells over time. This makes it possible to ask not only how many cells were CD14+ monocytes, for example, and separately how many secreted TNFα, but which specific subtypes did both. That overlay is only possible with same-cell measurements.
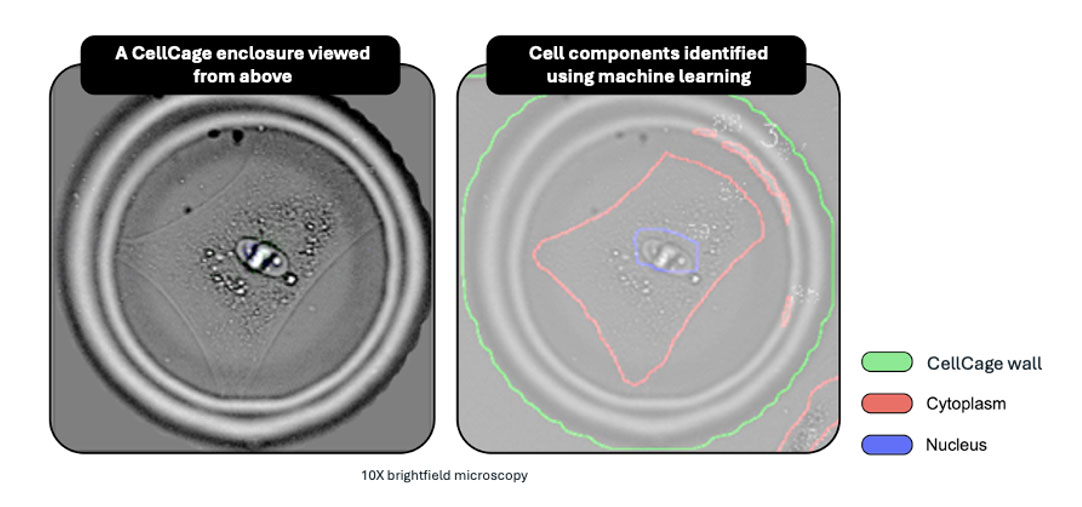
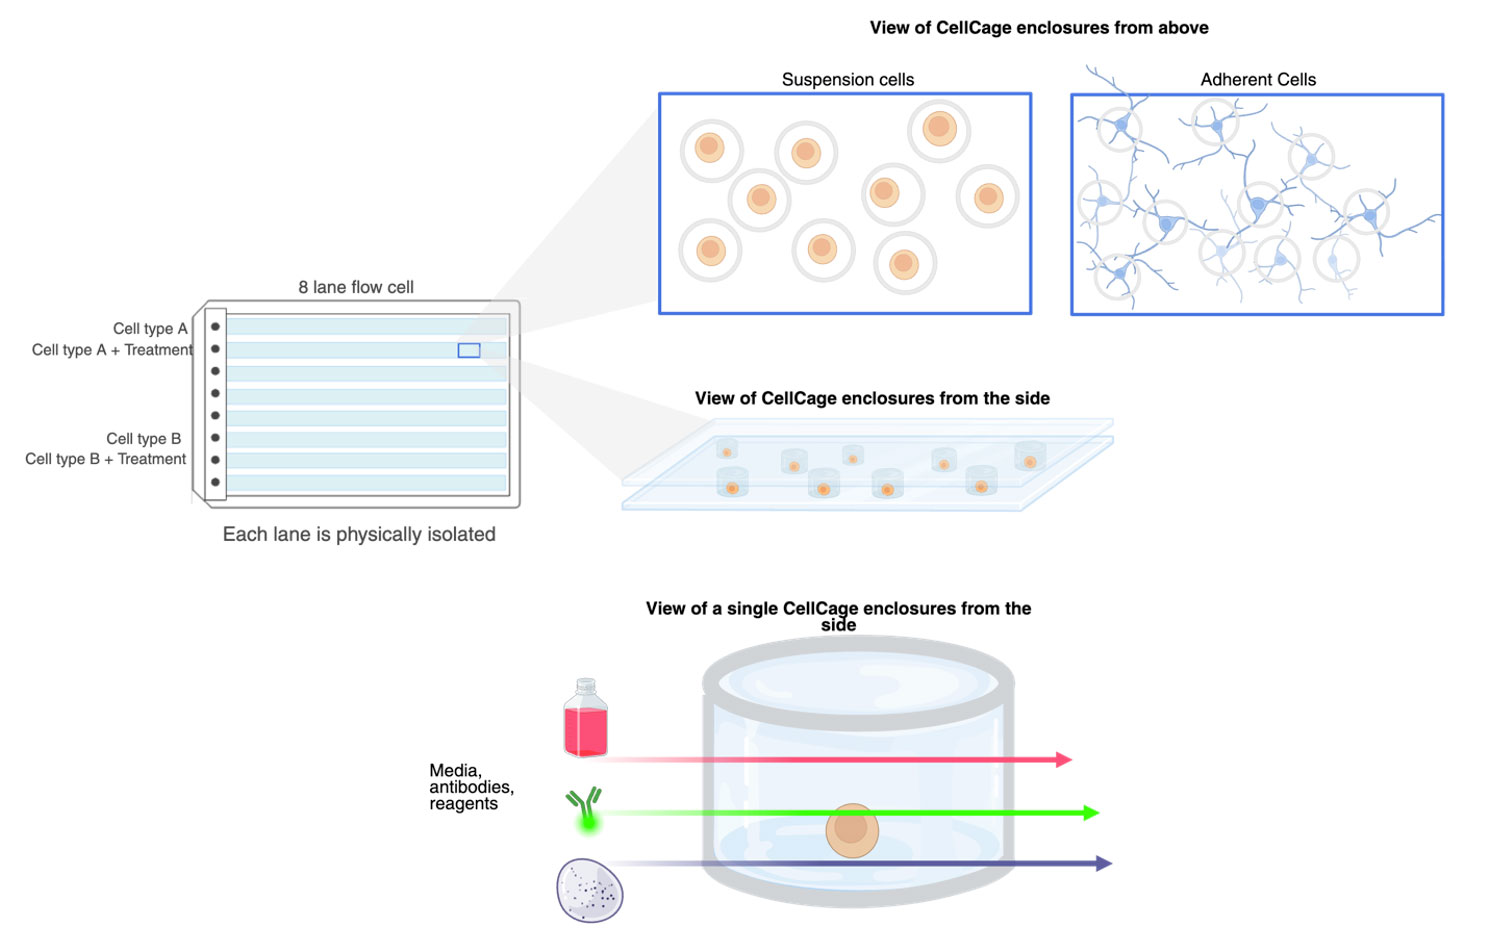
Meet CellCage enclosures
CellCage enclosures are biocompatible hydrogel microenclosures formed around cells on the flow cell surface by light-directed polymerization.
A CellCage enclosure is:
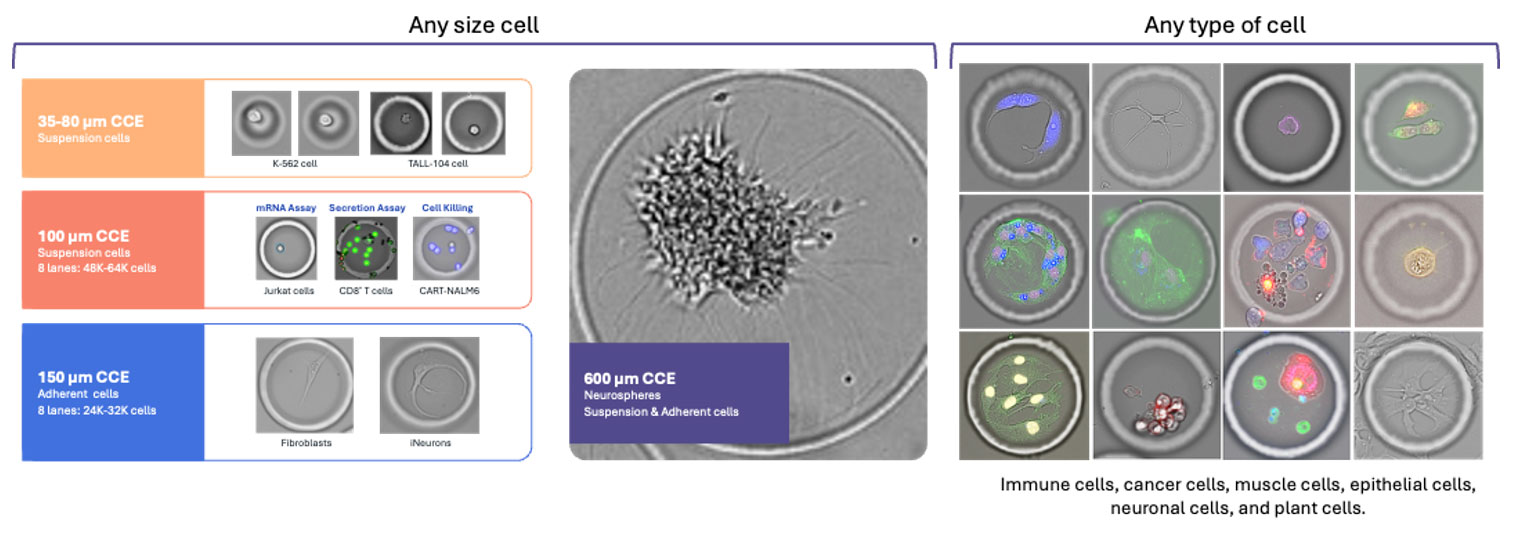
- Tunable in size and shape so that you can optimize throughput and characteristics for your cell type and assays.
- Permeable to media, reagents, antibodies, and small molecules, enabling sustained culture and controlled perturbations.
- Flexible enough to house single cells, defined pairs, co-cultures, or ensembles.
- Dissolvable at the end of the experiment, so nucleic acids can be captured for library prep.
Think of each CellCage enclosure as a tiny, addressable habitat where you can keep a cell or micro-community alive, watch what it does, and then ask why it did it.
How are CellCage enclosures formed?
No manual picking, no physical wells. Just programmable, light-patterned microenclosures defined by your biological criteria.
Before the experiment starts, you define which cells you want to capture, based on size, the presence or absence of a fluorescent signal, and whether you want them alone or paired with other cell types. You also set the caging parameters: how close enclosures can sit to each other, how large they should be, and so on.
Then, once you start a run:
- Image and identify cells
The instrument images the lane in brightfield and fluorescence microscopy. AI-based segmentation finds cells or ensembles that match your criteria (size, fluorescence intensity, co-localization) and flags them as targets. - Pattern the hydrogel around targets
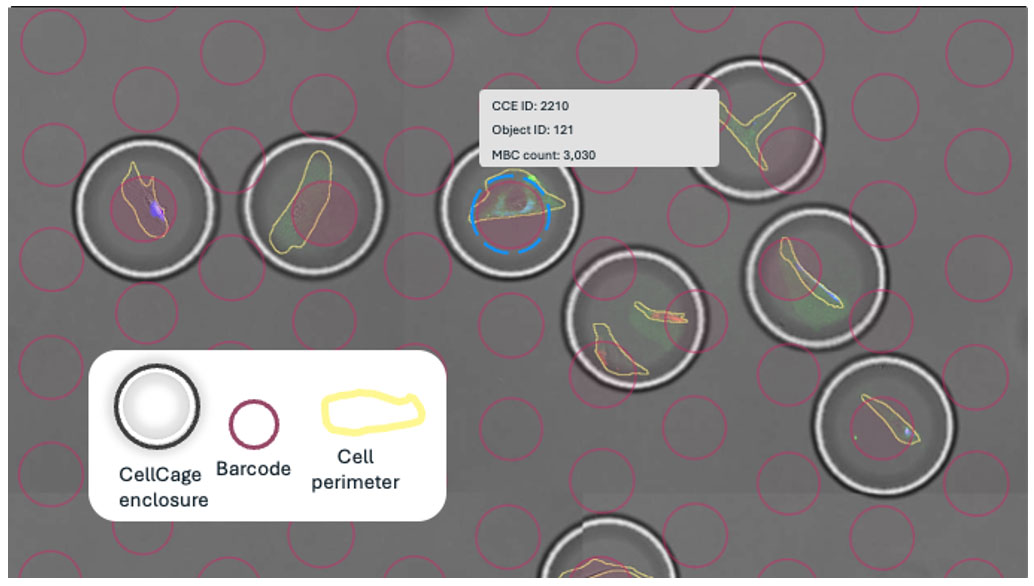
A digital micromirror device projects patterned light onto the flow cell, polymerizing the hydrogel only around the targeted cells. This creates thousands of individual enclosures in parallel. - Lock in addressable microenvironments
In minutes, you go from a field of cells to thousands of uniquely addressable, live microenvironments, each with a known coordinate and ID.
Life inside CellCage enclosures
Once enclosures are formed, the experiment really starts.
- Media and reagents flow; cells stay put
Laminar flow delivers media, compounds, or stains while cells remain enclosed and trackable. - Support for both suspension and adherent cells
Flow cell surfaces can be coated so neurons, fibroblasts, and other adherent cells grow with intact morphology, while suspension cells are confined but not forced into non-physiologic formats. - Lane-based architecture
Each lane is physically isolated. You can run different cell types or treatment conditions side by side without cross-contamination, and design clean baseline → pulse → washout sequences.
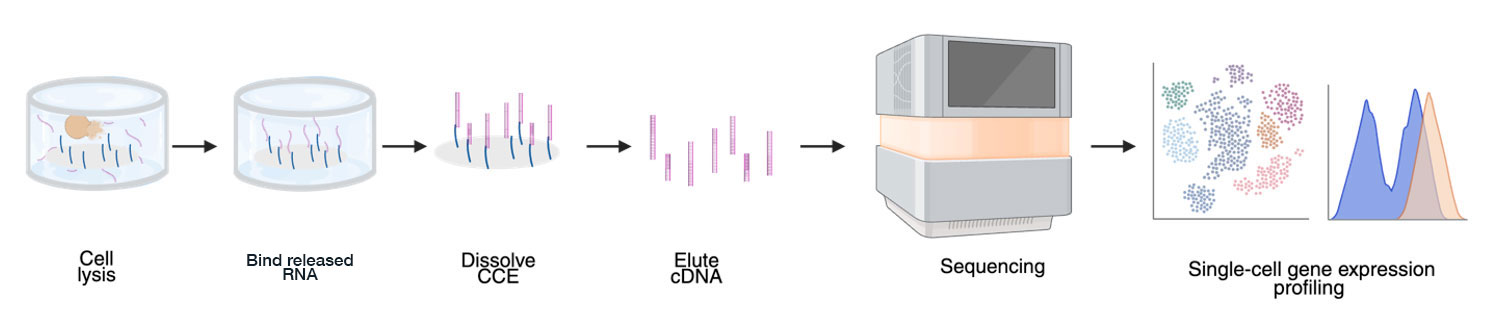
Closing the loop: from cell behavior to transcriptome
At your chosen endpoint:
- Cells are lysed within their CellCage enclosures
- RNA, and/or guides for CRISPR experiments, are captured on the flow cell surface.
- After RNA (and/or guides) are captured on the flow cell surface, the enclosures are chemically dissolved and the library is eluted for downstream sequencing.
Each enclosure carries a unique identifier tied to its coordinates on the flow cell that links the CCE location to the captured RNA. This combination means every sequencing read can be traced back to longitudinal images for the exact cell or ensemble, without any pooling or approximation.
In the Cellanome Cloud, the sequencing outputs are processed through STARsolo to generate per-CellCage enclosure gene expression counts, then integrated with image processing and feature extraction results. The pipeline delivers a Seurat object, where each CellCage enclosure, whether containing a single cell or ensemble, is linked to its images, morphological features, fluorescence signal, gating classification, and gene expression.
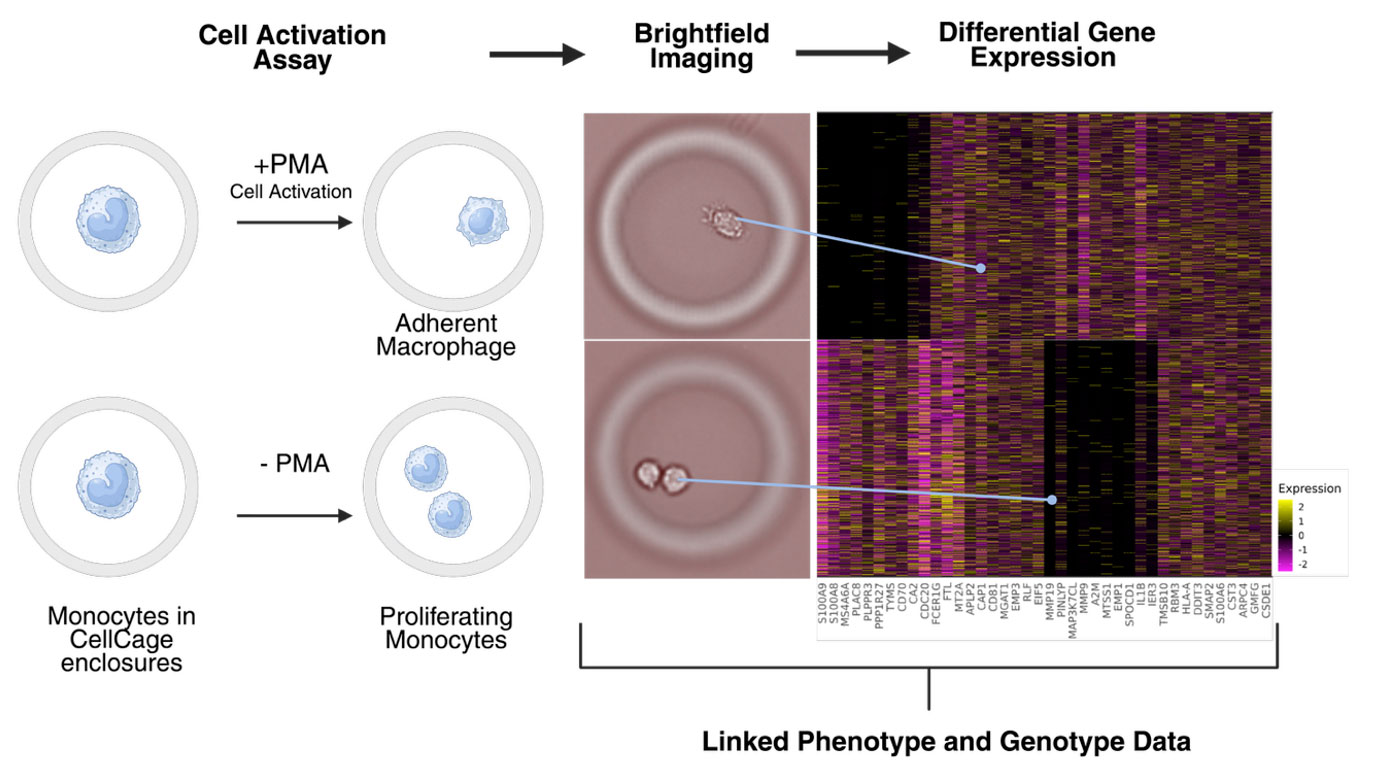
An immunology example: linking activation state to gene programs.
One simple way to see this in action is a monocyte‑to‑macrophage activation assay inside CellCage enclosures.
In this experiment, monocytes are enclosed and split into two conditions: with PMA (Phorbol 12-myristate 13-acetate) to drive their activation into adherent macrophages, and without PMA, where they remain as proliferating monocytes. Over time, Brightfield imaging makes the phenotypic split obvious: single, spread macrophages versus dividing monocytes in the same lane and run.
At the end of the assay, both populations are lysed in place and sequenced. Because each CellCage enclosure is uniquely linked, differential gene expression can be computed directly between cells that were visibly activated and those that were not, letting you tie activation‑specific transcriptional programs back to the exact cells you watched in the time‑lapse.
Multi‑modal assays: four dimensions in one experiment
One of the Cellanome R3200 platform’s defining features is its flexibility across experimental designs. Instead of committing to a single readout or rigid workflow, you can mix and match cell types, perturbations, time, and phenotypic readouts in the same run.
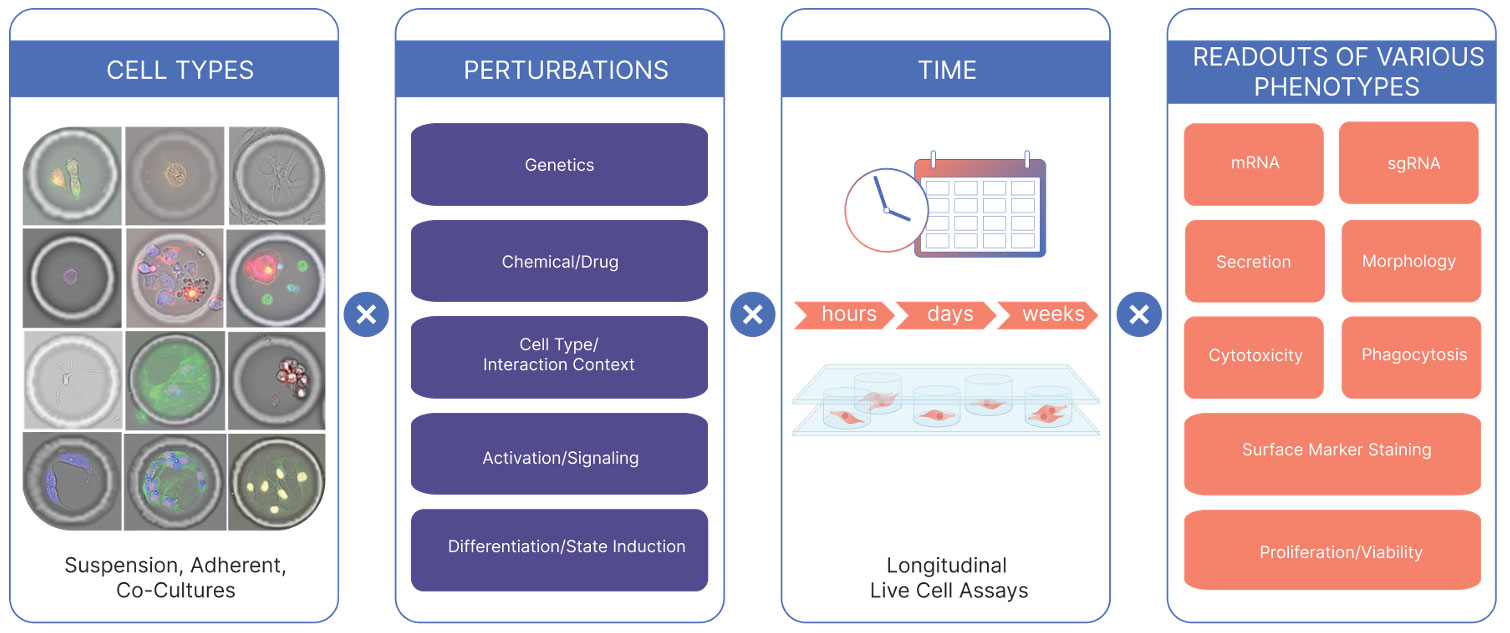
Four axes to design around
- Cell types
Suspension cells, adherent cells, and co‑cultures, spanning primary cells, cell lines, and iPSC‑derived populations relevant to disease research, including fragile or large cells. - Perturbations
Genetic edits (CRISPR, sgRNA libraries), chemical and drug treatments, effector–target co‑cultures and signaling partners, activation stimuli, and differentiation or state‑induction protocols. - Time
Treated as an experimental variable, not a fixed endpoint. You can design longitudinal live‑cell assays over hours, days, or weeks to capture transient responses, sustained transitions, and long‑term functional changes. - Same-cell phenotypic readouts
Brightfield imaging and up to four channels of fluorescence, using standard protocols and commercially available reagents — so if it works in your cell biolab, it can likely be adapted to run in a CellCage enclosure. AI-derived morphotyping extracts additional structure from Brightfield images without extra prep. Endpoint RNA-seq and CRISPR-seq via Cellanome kitted reagents.
Why this matters
What makes this powerful isn’t any one axis on its own, but the ability to cross them.
You can ask, in a single experiment: How do genetically edited primary T cells (cell type) respond to tumor co‑culture (perturbation) over 48 hours (time), as measured by killing efficiency, cytokine secretion, activation markers, and transcriptome (readouts)?
That four‑dimensional question used to generate a sprawl of aliquots — each readout, timepoint and condition its own separate population of cells. You could see that secretion was up, and that a transcriptional signature was enriched, but the specific cells that gave you one answer were rarely the cells that gave you another. The linkage was inferred, rather than observed.
On the Cellanome platform, it’s one lane.
This combinatorial flexibility lets you better match the multi-variable nature of biology, measuring multiple dimensions at once. Patterns that are invisible in single-variable or bulk assays, such as the transcriptomic signatures of high‑ vs low-secreting cells or morphological changes that precede functional shifts by hours, start to show up clearly.
Research potential across fields
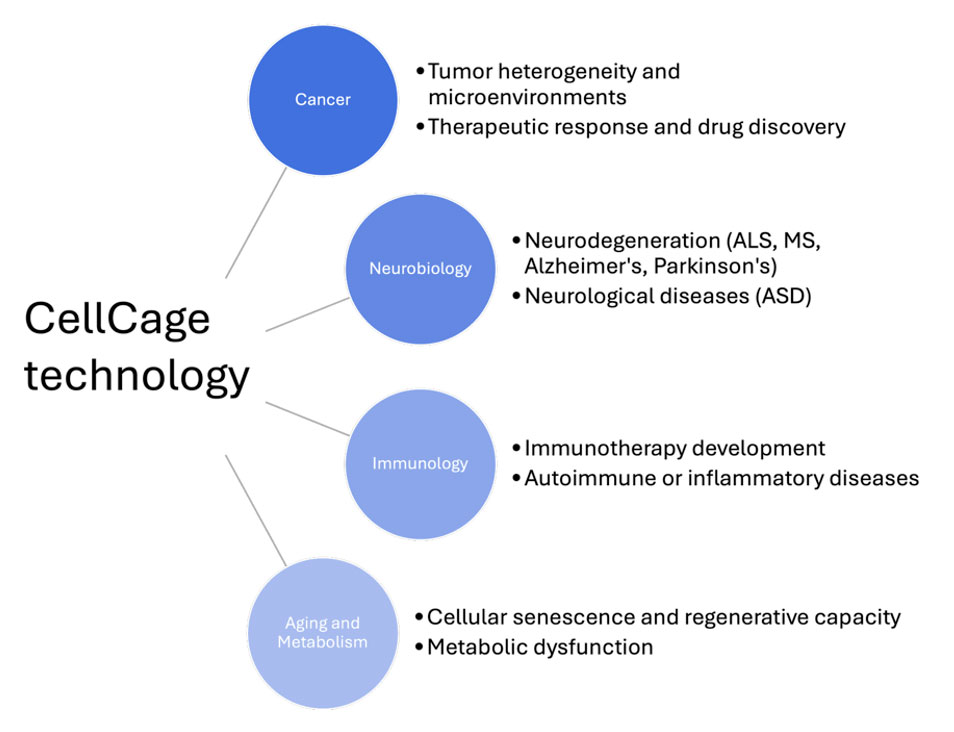
The same platform that links cell behavior to transcriptomics in a monocyte activation assay extends across immunology, oncology, neuroscience, aging, and functional genomics. In each case the core value is the same: watch what cells actually do over time and then ask why, from the same individual cells.
Early studies from Cellanome customers, scientists and collaborators are already turning up results in neurodegeneration, CAR-T cell therapy optimization, drug resistance and tumor heterogeneity, cellular senescence, and CRISPR functional screens.
We'll cover each of these areas in dedicated posts — experimental designs, real datasets, and the specific questions each application is best suited to address.
From Snapshots to Biology in Motion
Taken together, these early studies point to the same idea: once you can hold cells in relevant microenvironments, watch what they actually do over time, and then read out transcriptomics from the very same cells, whole classes of questions become tractable.
This blog will continue following that thread, sharing experimental designs, data stories, and lessons learned as we push on what's possible with live-cell, single-cell data.
If there's a model system, assay type, or disease area you'd like us to dig into first, connect with us. We'll let what's most useful to you shape what comes next.