
Resources: Blog
If you care about function, make function the response variable
Pier Federico Gherardini, VP Computational Biology
May 6, 2026
You are given a single-cell transcriptomic dataset, and you want to find the genes that drive a cellular function of interest, how do you go about it?
Most people will reach for clustering: group cells with similar expression patterns, then infer that those groups share something biologically meaningful.
Infer is the key word here. This assumption holds when defining cell identity, as different cell types do have globally different gene expression. But is this also true when looking at a specific cellular function within the context of one cell type?
In Khurana et al., we introduce CellCageTM Technology, a novel approach that enables longitudinal imaging of live cells paired with endpoint transcriptomics from the exact same cells. In other words, imaging tells us what the cell did while transcriptomics tells us which genes it expressed while doing it. When we pair the two, we can directly ask which genes drive function instead of having to infer it.
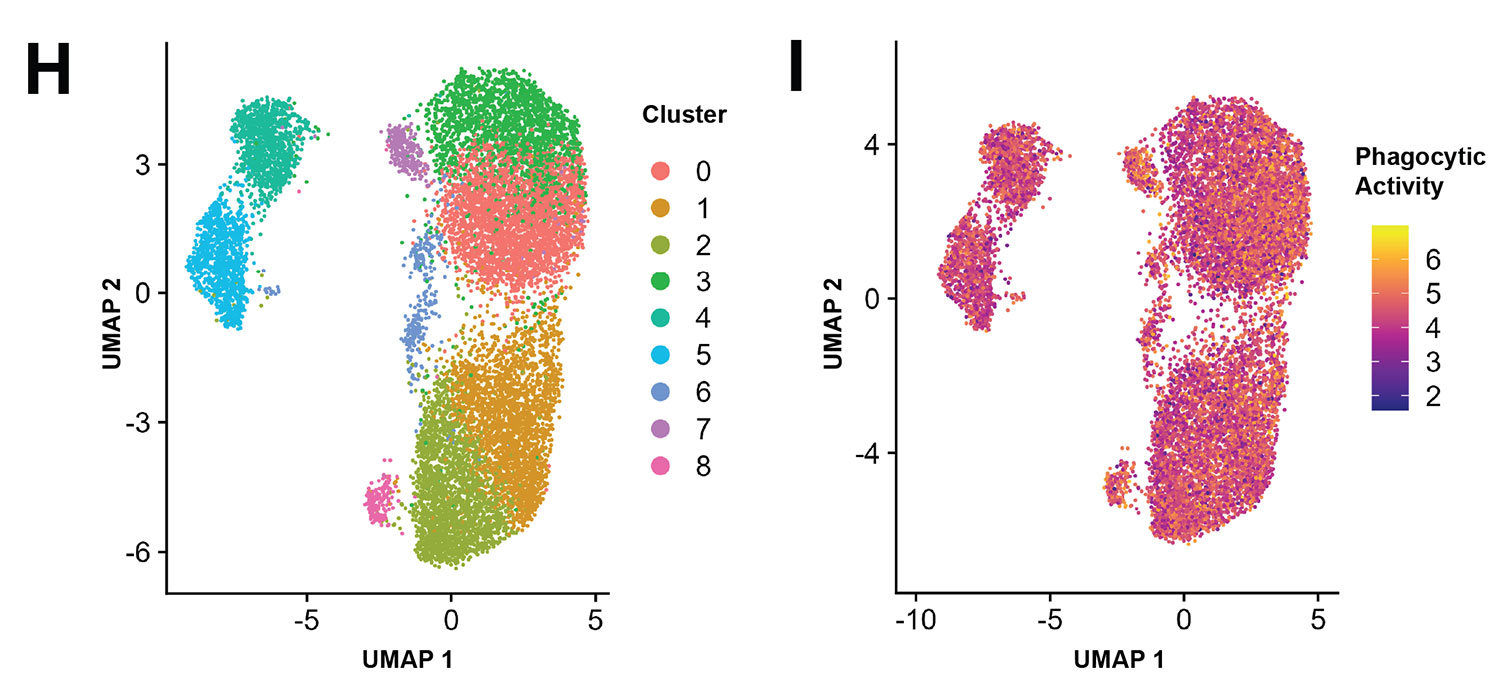
We looked at two different examples of function, the accumulation of lipids by differentiating preadipocytes and the phagocytic activity of microglial cells. As expected, in both settings, we observed heterogeneous levels of activity in the culture, and we asked what was driving this heterogeneity at the gene expression level.
Interestingly, in both cases, when we performed unsupervised clustering of the gene expression data, the level of functional activity of the cells did not clearly segregate with the clusters. The major axes of variation in the gene expression data were unrelated to the function we were interested in. In other words: clustering finds the genes that vary most across the population. But the genes that vary most aren’t always the genes that matter for a specific function.
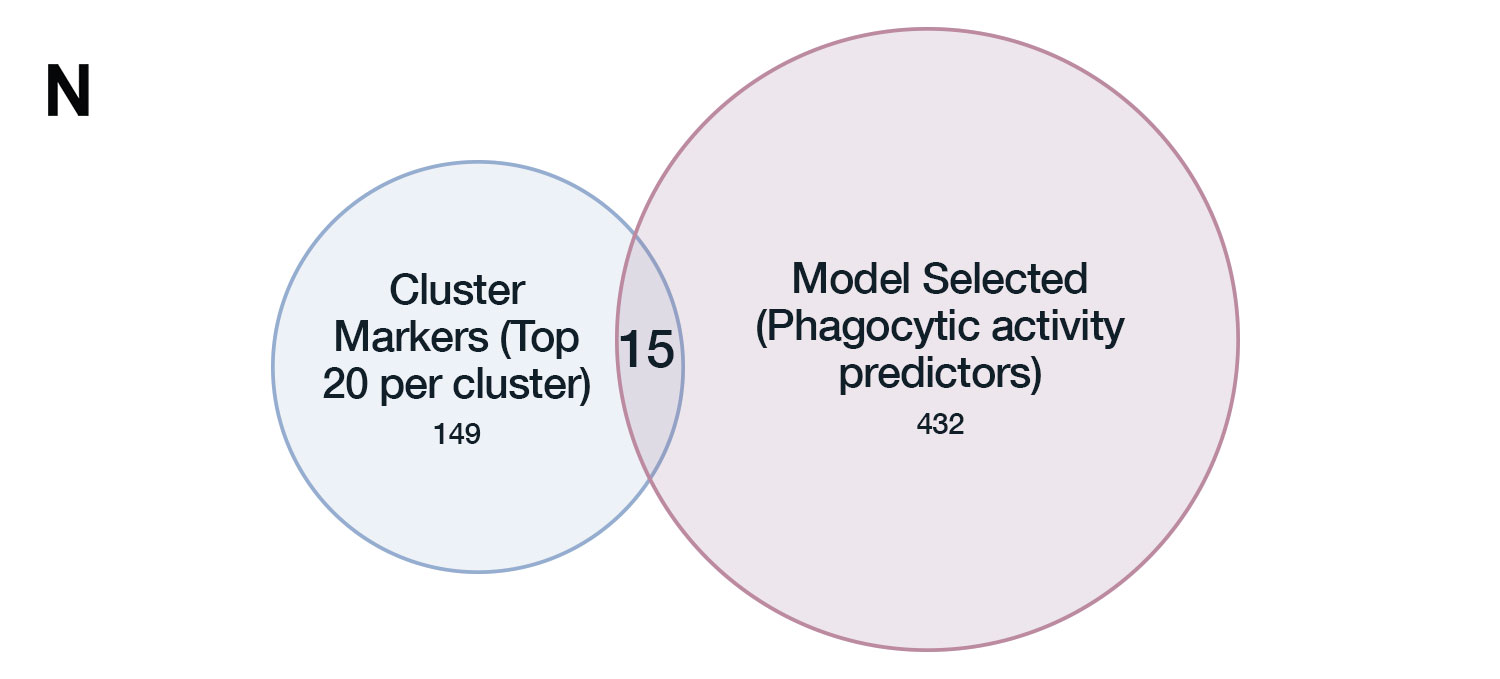
Therefore, instead of using an unsupervised approach, we leveraged the paired nature of the data to build a supervised elastic net model that would use gene expression to predict function directly. In both cases, the overlap between the genes selected by the model and the differentially expressed genes between the transcriptomic clusters was minimal.
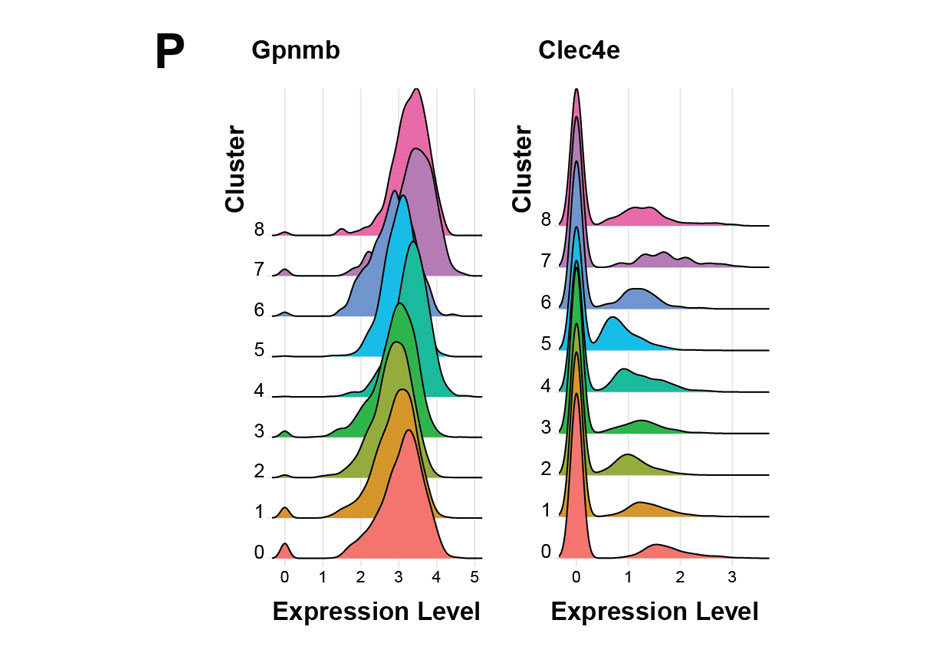
Top predictors of phagocytic activity included genes like Gpnmb and Clec4e, which have clear, published, mechanistic evidence of their involvement in phagocytosis, and yet their expression was pretty much uniform across the transcriptomic clusters.
These examples illustrate two key points. First, global differences in gene expression patterns do not necessarily capture variation related to a biological function of interest. Second, having functional and expression measurements paired in the same individual cells provides a direct path to identifying functional drivers. It’s the pairing that enables building models. If functional and expression data had been measured on two different platforms, with different cell aliquots, there would be no response variable to fit a model to.
Those observations raise a natural next question: What else does the paired imaging layer provide beyond a functional score? After all, live cell imaging captures far more than a single fluorescence intensity readout. It captures morphology: the size, shape, and texture of cells. And it captures temporal history: how cells arrived at their current state through division, state transitions, or response to perturbation. Both dimensions contain information that a transcriptional snapshot alone does not.
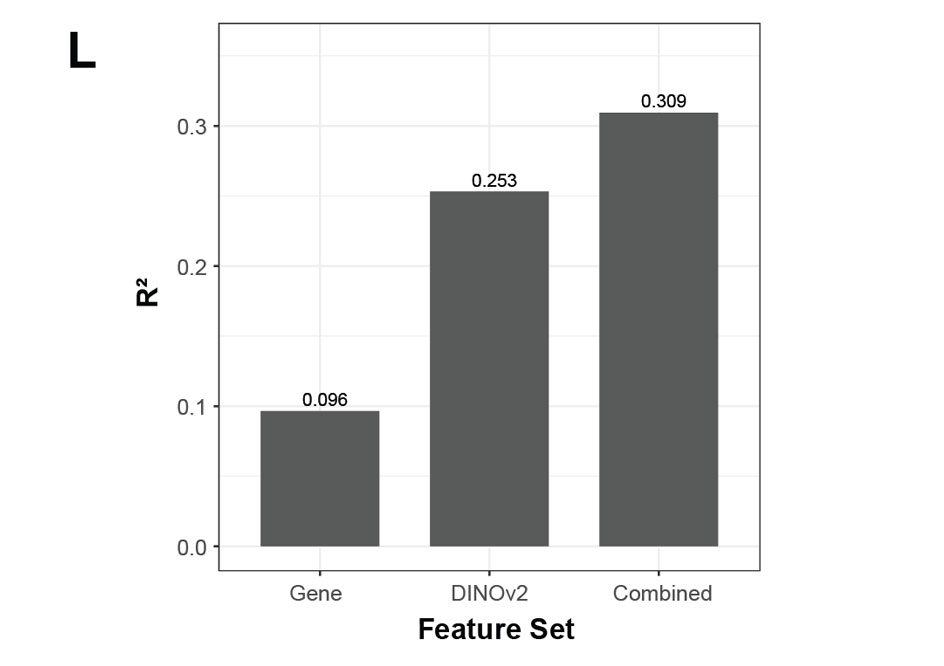
Along with traditional measures (size, shape, eccentricity), we also used embeddings from DINOv2 (a foundation model trained on natural images) to extract semantically-rich morphological descriptors from images of the microglial cells. We compared three elastic net models for predicting phagocytic activity: expression-only, morphology-only, and combined. Morphology alone predicted phagocytic activity better than gene expression alone. The combined model out-performed both, showing that morphology adds orthogonal signal.
In A549 lung cancer cells treated with Olmutinib (an EGFR inhibitor), we identified a population of cells with a resistant phenotype driven by upregulation of potassium channels and p53-enabled quiescence/slow-cycling (A549 cells are p53 wild type). An obvious question is: did this population originate because of adaptation to drug pressure, or did it pre-exist as a resistant clone?
The longitudinal imaging told the story. This state was preferentially associated with cells that had divided from the same progenitor, but where one of the daughter cells had died while the other survived. This clearly shows that these resistant cells are not a pre-existing population, as the two cells were siblings, and yet one of them died and the other survived. The most obvious explanation is that the surviving daughter stochastically sampled a gene expression state that happened to be protective.
Over and over again in Khurana et al., we found that longitudinal imaging data is rich with information, and it is especially powerful when paired with transcriptomics. In thinking about the future, we are excited about using this type of multimodal data to develop better virtual cell models.
By and large, current models are trained exclusively on expression data. They learn to simulate gene regulatory networks, but a regulatory network alone doesn't tell you what a cell does. The mapping from expression to function is missing, and we believe it must be measured, not inferred. It is not simply a matter of more transcriptomic data; instead, it requires ground-truth functional labels that most training sets lack. That is the layer that paired imaging and transcriptomics provides. Not a replacement for expression-based foundation models, but the missing piece needed to model how cells function in health and disease, not just which genes they express.