

Resources: Posters
Longitudinal Imaging of the Same Cell Anchors Transcriptional Trajectories of Adipogenic Commitment
November 6, 2026
CSHL: Cold Spring Harbor Labs Biological Data Science Meeting
Juan Pablo Romero, Ph.D., Staff Scientist, Computational Biology, Cellanome
Keywords: Single-cell trajectory inference, pseudotime, long-read single-cell RNA-seq, isoform switching, morphodynamics, DINOv2 embeddings, multimodal single-cell data
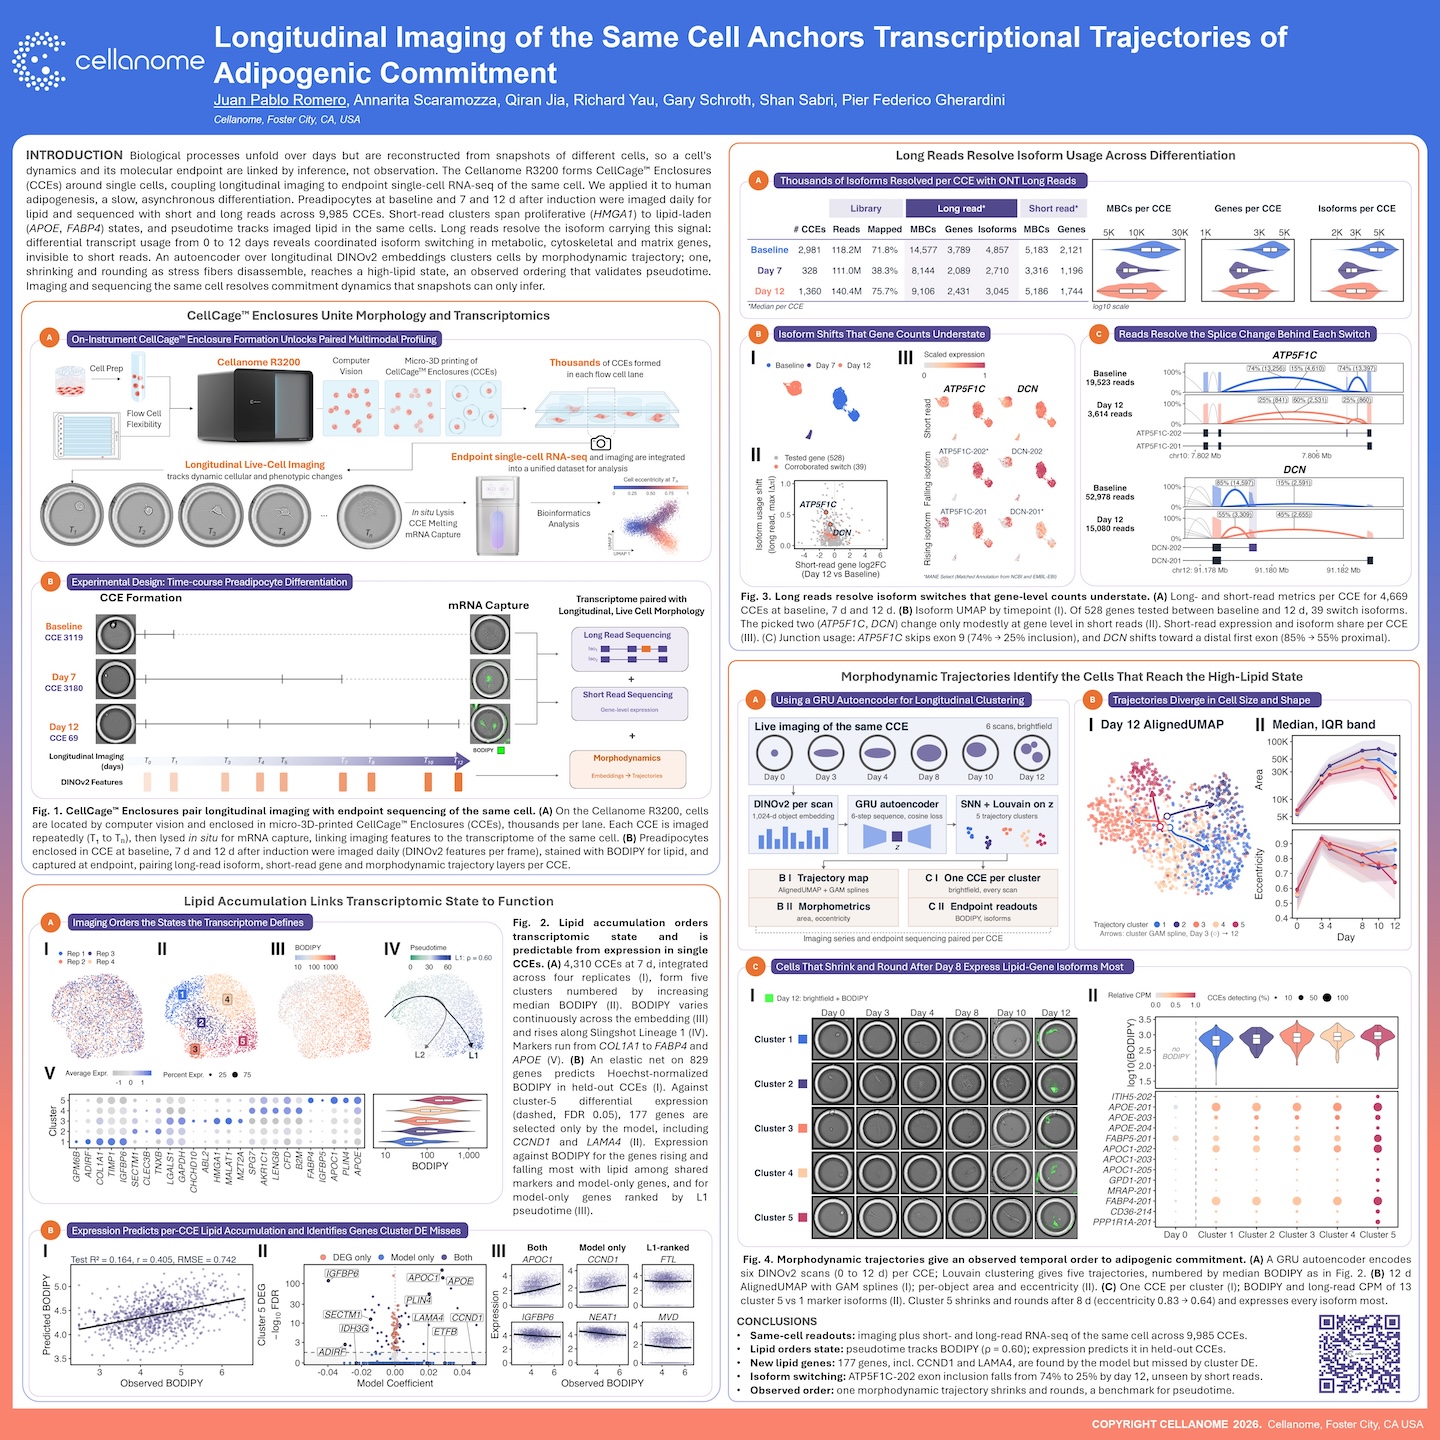
This poster shows how imaging and sequencing the same cell can give single-cell trajectories an observed order, rather than one inferred from snapshots of different cells. On the Cellanome R3200, human preadipocytes were cultured in CellCage™ enclosures and imaged repeatedly for lipid at baseline, 7 days, and 12 days after induction. They were then sequenced with both short and long reads, across 9,985 enclosures. The results:
- Lipid tracks pseudotime. Pseudotime tracked imaged lipid in the same cells (ρ = 0.60).
- The model finds genes cluster analysis misses. An elastic-net model on 829 genes predicted lipid accumulation in held-out cells. It selected 177 genes, including CCND1 and LAMA4, that differential expression between clusters missed.
- Long reads show isoform switching. Of 528 genes tested, 39 switched isoforms between baseline and day 12, a change that short-read gene counts understated. For example, ATP5F1C exon 9 inclusion fell from 74% to 25%.
- Morphology gives an observed order. A GRU autoencoder over longitudinal DINOv2 embeddings grouped cells into five trajectories. One trajectory shrank and rounded after day 8 and reached the high-lipid state.
That observed ordering offers a benchmark for trajectory inference methods.
FAQ's
Why is single-cell trajectory inference hard to validate?
Most single-cell methods destroy the cell they measure, so trajectories like pseudotime are reconstructed from snapshots of different cells. A cell’s dynamics and its molecular endpoint are linked by inference, not observation. Here, each cell was imaged over time and then sequenced, so its history and transcriptome come from the same cell.
What data does each CellCage enclosure produce?
Each enclosure contributes daily brightfield images converted to DINOv2 features, BODIPY lipid staining, short-read gene expression, and long-read isoform data. These are linked into one per-cell dataset. This study covered 9,985 enclosures across three timepoints.
What do long reads add over short-read single-cell RNA-seq?
Long reads resolve which isoform a gene expresses, not just how much. Of 528 genes tested, 39 switched isoforms between baseline and day 12, in metabolic, cytoskeletal, and matrix genes. Several of these, such as ATP5F1C and DCN, changed only modestly at the gene level, so short reads alone would understate the shift.
How were morphodynamic trajectories built, and how do they relate to pseudotime?
A GRU autoencoder encoded each enclosure’s longitudinal series of six DINOv2 embeddings into a latent representation, and Louvain clustering of these representations yielded five trajectories.