

Resources: Posters
Paired longitudinal live-cell imaging and transcriptomics enable deeper characterization of cells
November 2, 2026
SBI2: Society for Biomolecular Imaging & Informatics
Pier Federico Gherardini, Ph.D., Head of Computational Biology, Cellanome
Keywords: Functional genomics, target discovery, phenotypic screening, multimodal single-cell profiling, live-cell imaging, AI-based morphological profiling, DINOv2
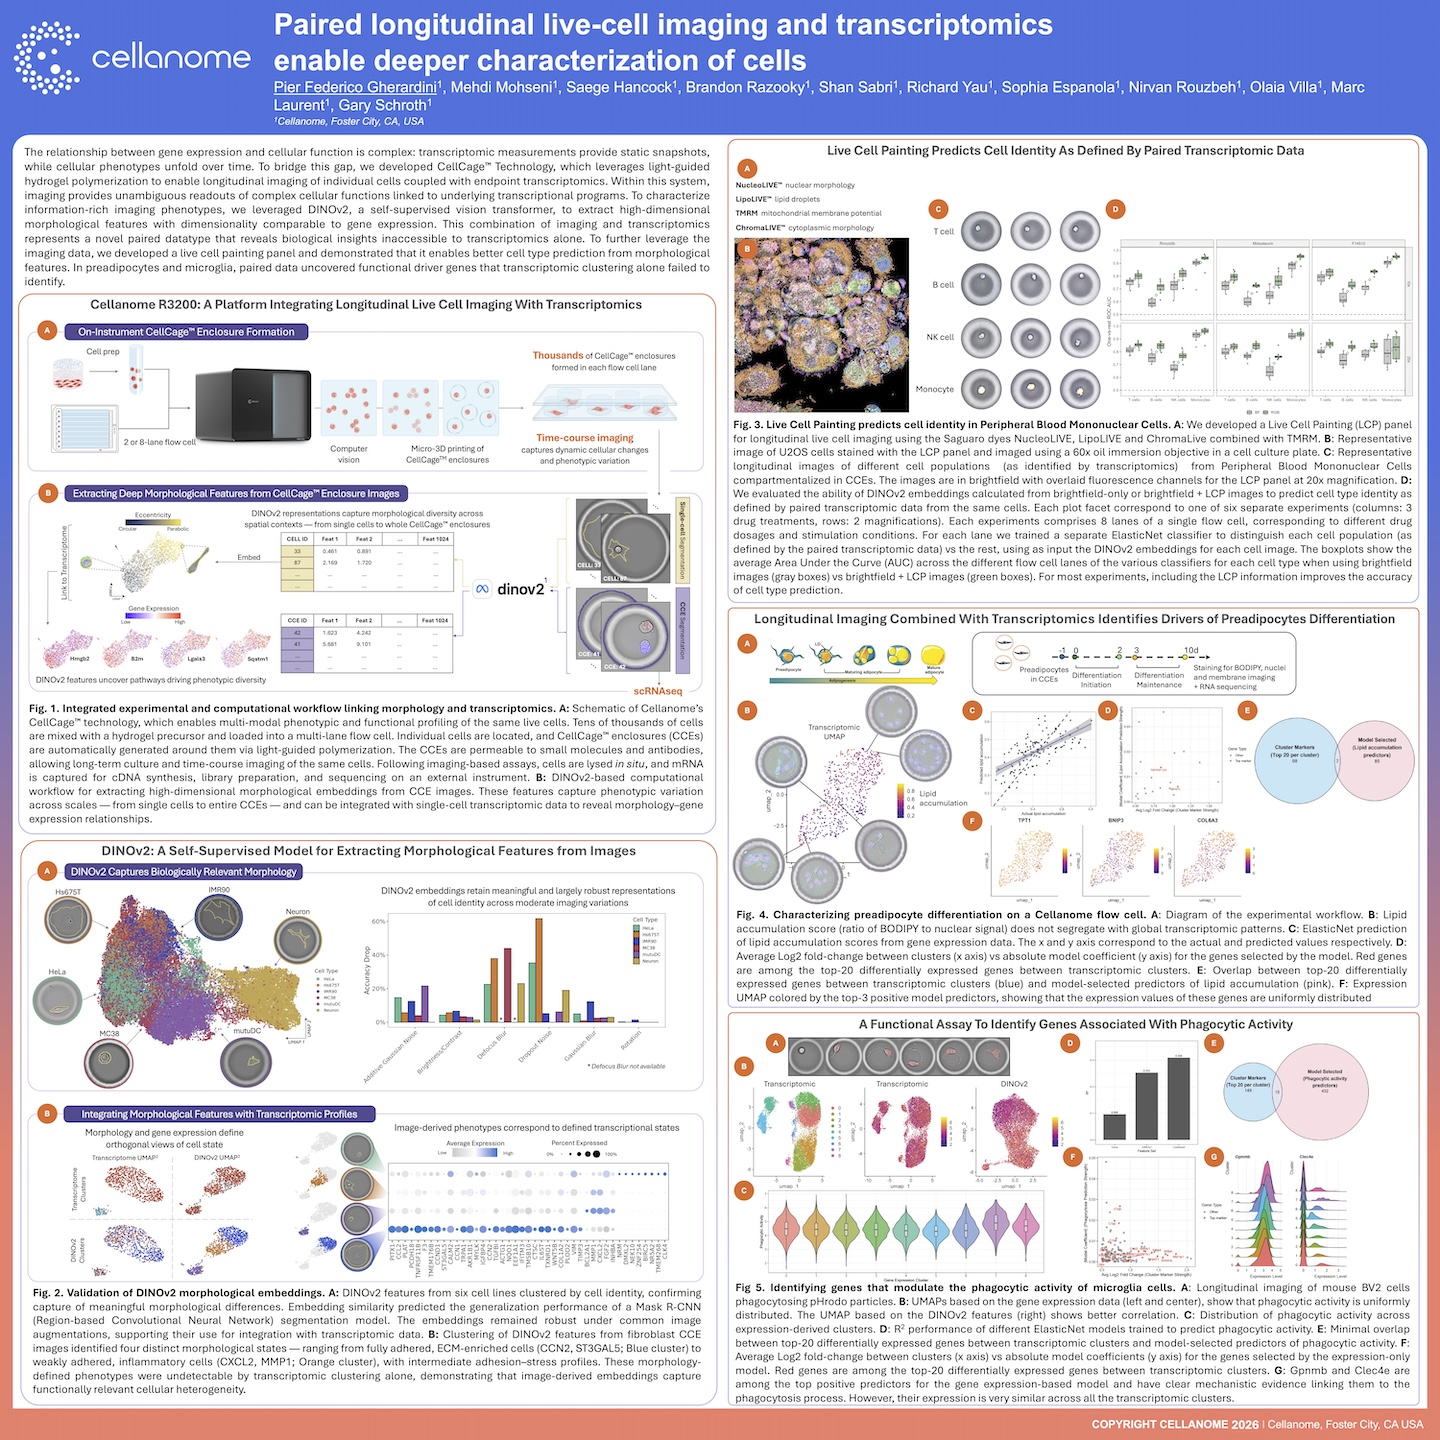
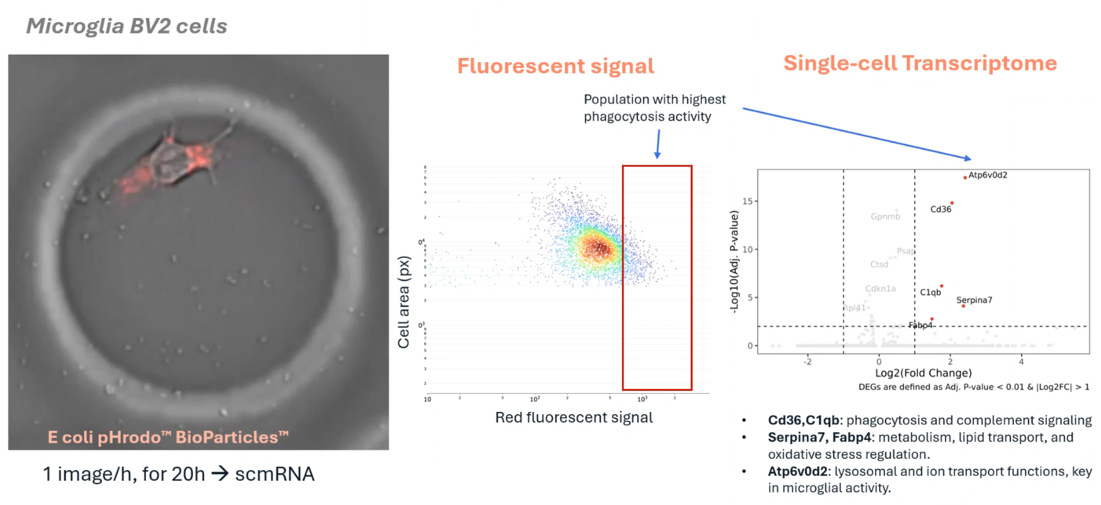
This poster presents a multimodal single-cell workflow that links what cells do over time to the genes behind it. Cells were cultured in CellCage™ enclosures on the Cellanome R3200, imaged longitudinally, and then profiled by whole-transcriptome RNA-seq, all from the same cells. DINOv2, a self-supervised AI vision model, turned each image into high-dimensional morphological features that can be analyzed alongside gene expression. These features separated cell identity across cell lines and revealed four fibroblast states, from adhered and ECM-enriched to inflammatory, that transcriptomic clustering alone could not detect. A Live Cell Painting panel built with Saguaro dyes improved cell type prediction in PBMCs across drug treatments and doses. In functional assays of preadipocyte lipid accumulation and microglial phagocytosis, the linked data identified predictive genes with little overlap with standard differentially expressed genes, including Gpnmb and Clec4e in microglia. That makes the approach a foundation for phenotype-driven target discovery and compound screening.
FAQ's
Why can’t single-cell RNA-seq alone identify the genes that drive a cell’s function?
Transcriptomics is a static snapshot, and functional differences often don’t line up with expression clusters. In this study, lipid accumulation and phagocytic activity were spread evenly across transcriptomic clusters. The genes that predicted them overlapped very little with the top differentially expressed genes. Measuring function and expression in the same cell is what revealed the drivers.
How could this approach support target discovery?
Each cell’s functional readout (such as lipid uptake or phagocytosis) is linked to its whole transcriptome. Models can then rank genes by how well they predict that function. This surfaces candidates like Gpnmb and Clec4e in microglia, which have known links to phagocytosis but would be missed by cluster-based analysis.
Can this workflow be used for phenotypic or compound screening?
Yes. Each flow cell has up to 8 lanes, and each lane can run a different drug, dose, or stimulation condition. In the PBMC experiments, cells were profiled across 3 drug treatments, with lanes covering different doses and conditions. Imaging and transcriptomics were read together, so compound effects can be tracked at the level of both phenotype and gene expression.
What does AI-based morphology add beyond standard image analysis?
DINOv2 extracts rich features without manual labels, at a scale comparable to gene expression data, so the two can be combined directly. The features held up under common imaging variations and captured cell states that expression data could not resolve on its own.